Case study
A siting recommendation is useful only when the criteria, weights, exclusions and trade-offs remain inspectable after the map looks convincing.
PV site selection combines data with judgment: terrain, climate, infrastructure, land cover, exclusions and economic assumptions all shape the answer. The project turns those inputs into a defensible workflow rather than presenting a suitability heatmap as unexplained truth.
Role & scope
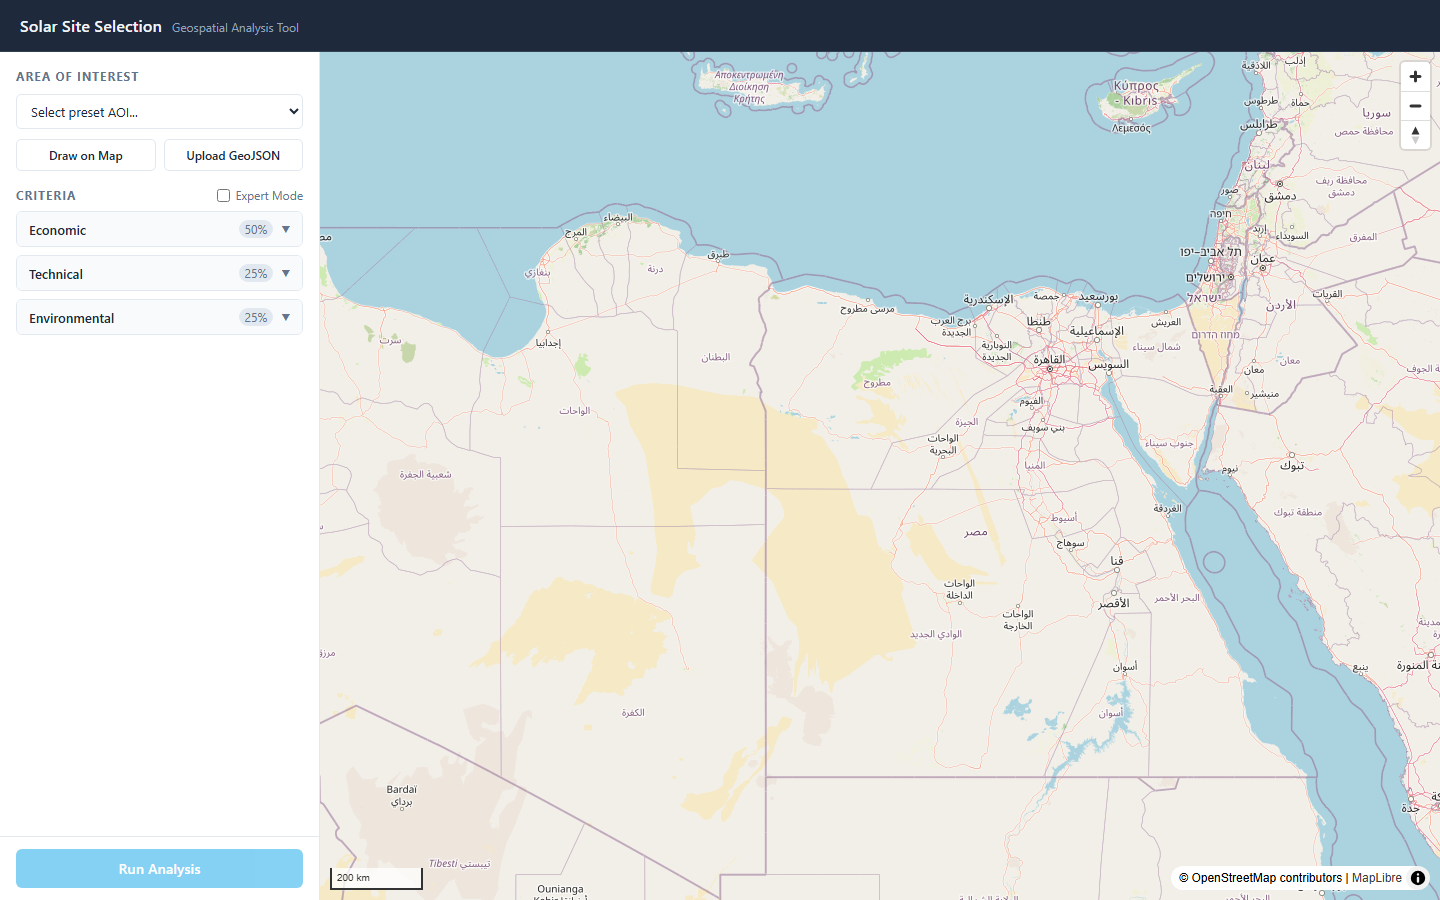
A web-based geospatial engine that acquires public data, runs consistency-checked AHP/MCDA, produces a five-class Land Suitability Index, extracts and ranks candidate sites, estimates pvlib energy/LCOE and exposes the workflow through FastAPI, React/MapLibre and PDF export.
Approach
How the system earns the result.
01 — Acquire
Build the AOI from public geodata.
PVGIS, Copernicus GLO-30, OSM/Overpass, ESA WorldCover, Open-Meteo and WDPA feed the analysis, with repeat results cached for reproducibility and speed.
02 — Analyze
Make the weighting model inspectable.
Twelve criteria across economic, technical and environmental groups are reclassified and combined through AHP. Pairwise matrices with a consistency ratio above 0.10 are rejected.
03 — Exclude
Remove impossible areas before ranking attractive ones.
Protected areas where available, water, urban cores and safety buffers are applied as hard exclusions before suitability scoring and site extraction.
04 — Rank
Turn a raster into decisions a user can inspect.
The continuous score becomes a five-class LSI, connected candidate polygons are ranked, and per-site energy plus simplified LCOE estimates are attached for comparison and export.
Evidence
What can actually be checked.
Decision model
12 criteria
Criteria are grouped under documented economic, technical and environmental weights rather than hidden in a single opaque score.
Suitability output
5 classes
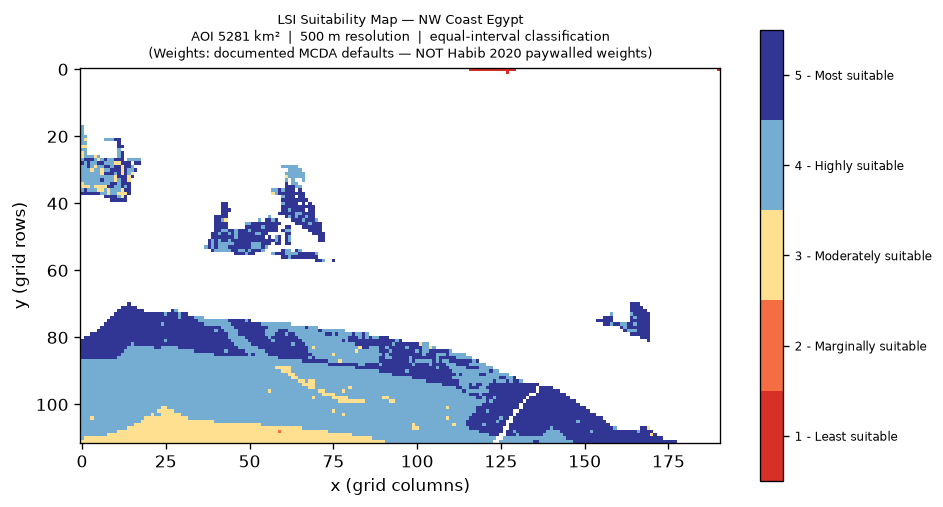
The public validation output spans Most Suitable through Least Suitable and is preserved as a committed map artifact.
NW coast validation
34.22%
Share of valid area classified in the top suitability class for the documented 500 m validation run; divergence from the paper anchor is explicitly discussed.
Delivery
Map → PDF
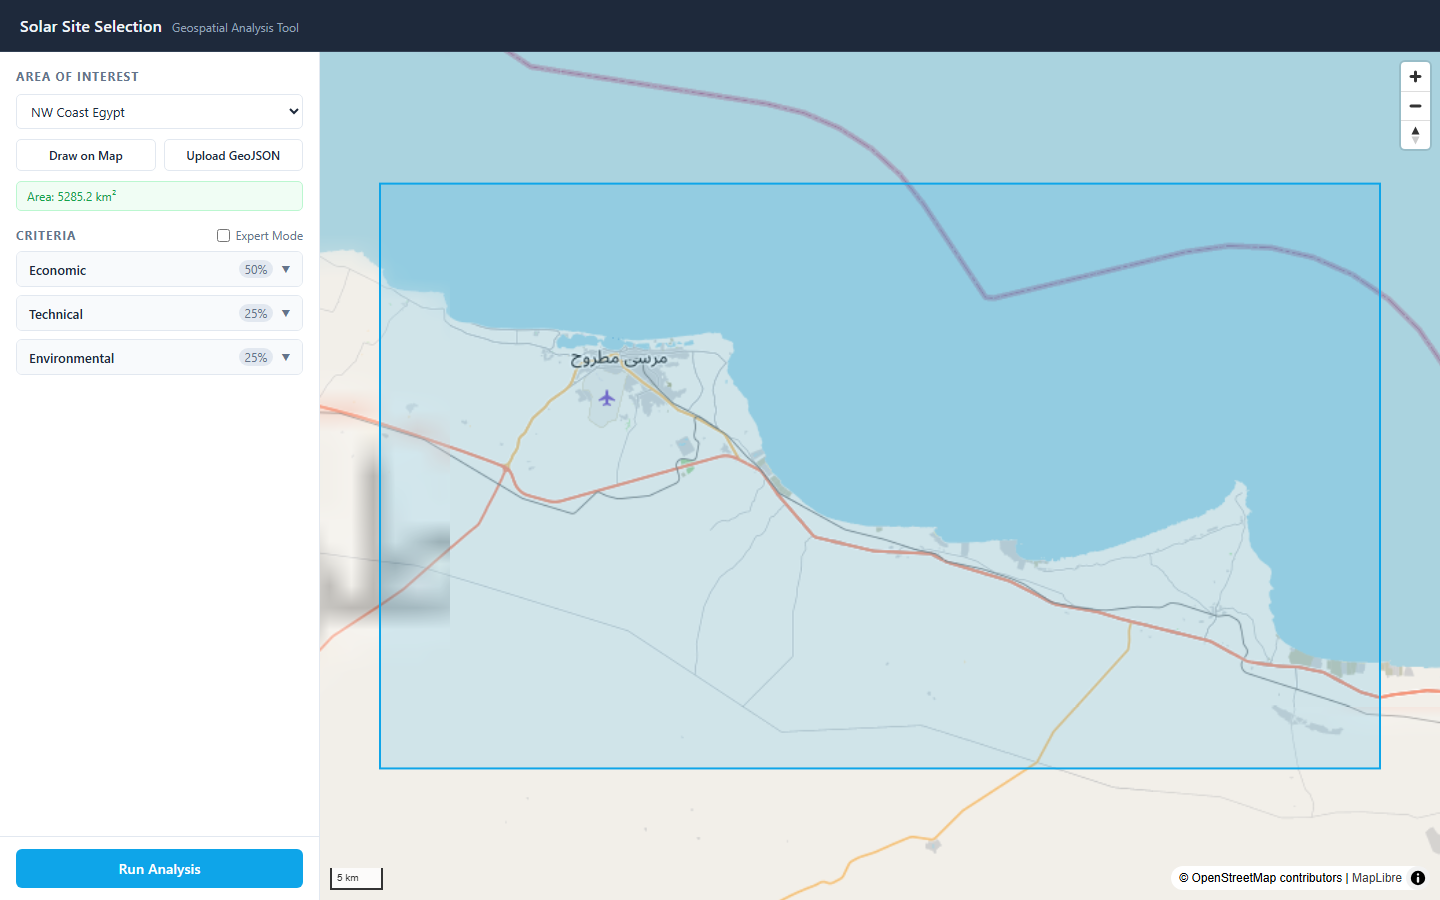
The public product carries a drawn AOI through analysis, ranked sites, map layers, energy/economic estimates and report export.
Limits & boundaries
What the case study does not pretend.
WDPA protected-area exclusions are Egypt-only in the deployed workflow because the licence-restricted dataset is not bundled globally; the UI states when the exclusion is unavailable.
AHP weights are documented MCDA defaults, not the paywalled pairwise matrices from the comparison paper, and remain subjective/editable inputs.
LCOE values use simplified fixed defaults and are not a substitute for project-specific land, grid and financing economics.
Publication boundary
The validation difference is kept visible rather than presented as reproduction parity. The larger AOI, newer datasets and different documented AHP weights materially change the comparison.
From proof to useful work
Where this project maps to real service work.
These links come from the governed project/service evidence map. They are not generic cross-sells and do not widen the claims made above.
Next project · Mobile product leadership
Makhbazy